
The better your data observability platform works, the harder it is to justify at budget time. Here is a framework that converts invisible prevention into numbers leadership can act on.
The Problem With Proving A Negative
Your CDO walks into a budget review. He sees no major incidents this quarter, no stakeholder escalations, no pipeline fires. The first question across the table: “What are we paying for?”
That is the core tension of data observability ROI. When the platform is doing its job, the business does not feel it. Silence is the success signal, and silence does not survive a budget conversation.
Most teams try to plug this gap with platform metrics. Monitors deployed. Alerts resolved. Rules configured. Those numbers tell leadership that the tool is running. They do not tell leadership what would have happened without it.
What actually works is a four-layer framework that maps observability outcomes to the things the business already cares about: cost, time, trust, and AI reliability.
Layer 1: Cost Avoidance
Every data incident carries a cost. Most organizations never calculate it. Engineering hours pulled off roadmap work to triage a broken pipeline. SLA breaches. Business decisions were made on reports that were silently wrong for three days, and regulatory exposure from compliance data that nobody flagged.
Start with this formula:
Data downtime cost per incident:
(Tables affected ÷ 15) × MTTD × MTTR × Loaded hourly cost
Run it on the last quarter. Assume 300 tables in your pipeline, a mean time to detect of four hours, a mean time to resolve of six hours, and a loaded engineering cost of $150 per hour. That comes to $7,200 per incident before you account for the decisions that were run on bad data during that window.
Multiply by incident frequency. The platform cost quickly starts to look like a rounding error. Every hour your observability platform shaves off MTTD or MTTR is a direct, calculable cost avoidance. Lead budget conversations with this number, not monitors configured or alerts resolved.
Layer 2: Operational Efficiency
Cost avoidance tells you what you did not lose. Operational efficiency tells you what you get back.
Before observability, data teams operate under reactive overhead: manual pipeline checks, stakeholder complaint triage, and root cause hunts, with no centralized lineage. This is invisible engineering time, and it compounds every week. Track the shift across five signals:
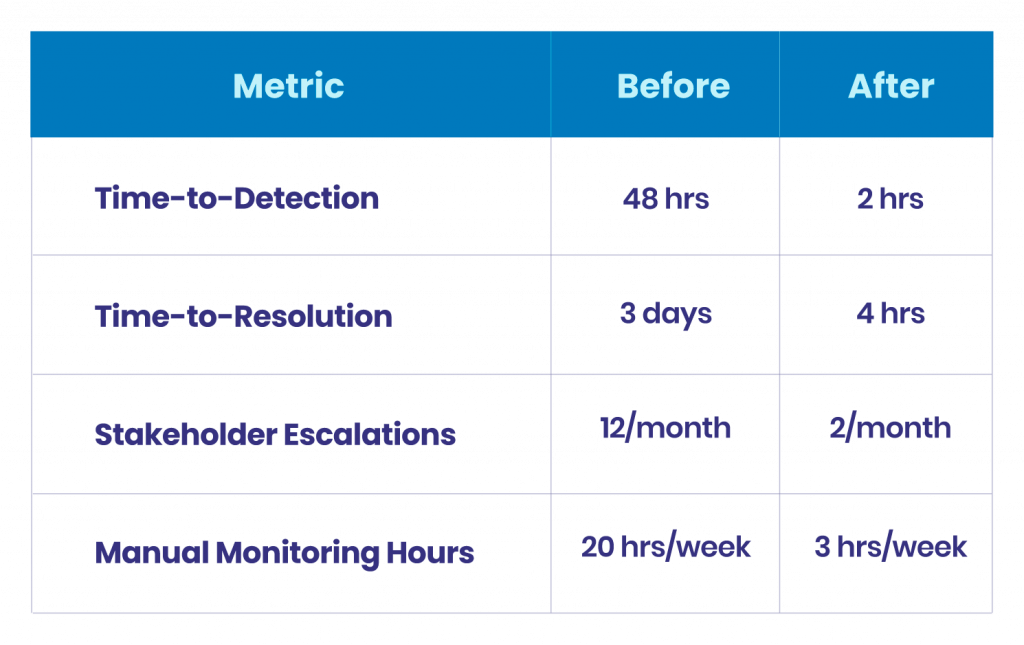
- Time-to-detection (TTD): Moving from 48 hours to under two is not incremental. The team stops learning about problems from Slack and starts learning from the platform.
- Time-to-resolution (TTR): With lineage, anomaly context, and impact scoping built in, the resolution that once took three days now takes hours.
- Stakeholder escalations per month: Track how often the business comes to your data team with “something looks wrong.” That number should drop sharply after deployment.
- Manual monitoring overhead: How many engineering hours per week go to pipeline babysitting? Observability should reclaim that time for roadmap work.
- Platform adoption: Rising weekly active users reflect genuine team trust in the tool, a leading indicator that it is changing how people work.
Layer 3: Data Trust and Business Velocity
Reliable data does not just prevent bad decisions. It accelerates good ones. When business stakeholders trust their dashboards, they stop questioning reports and start acting on them. When analysts are not spending half their week validating numbers before sharing them, they are building models and surfacing insights.
Three signals capture this layer. First, decision cycle time: how long from data availability to business decision? Shorter cycles mean trust is translating into velocity. Second, dashboard and report adoption: rising usage is a proxy for confidence, and declining usage often signals broken trust that nobody surfaced to the data team. Third, data credibility meetings per quarter: every organization runs them, the recurring sync where two reports show different numbers. A meaningful reduction is direct evidence of upstream reliability.
This layer connects observability to something executives genuinely care about: the speed at which the organization makes data-driven decisions without friction.
Layer 4: AI and Automation Readiness
In 2026, this layer changes the entire ROI conversation. AI is in the decision loop right now, across pricing recommendations, credit models, demand forecasts, and churn predictions. Every one of those systems shares a critical dependency: the quality of the data flowing into them.
The risk here is different from a broken dashboard. Bad data going into an AI system does not produce an error. It produces a confident wrong answer. That is why data observability is now AI infrastructure, not just a data quality tool.
Make this connection explicit. Track whether the platform is watching model input tables for schema changes, null rate shifts, and distribution anomalies. Measure how often training data drift is caught before it degrades model performance. And track speed-to-production for AI projects: teams with mature data observability deploy AI initiatives faster because they are not blocked by data-quality uncertainty at every stage of development.
When you frame observability as AI infrastructure, the budget conversation shifts. It is no longer a data team tool. It is a prerequisite for the AI investments the business is already making.
Building The Quarterly Narrative
With these four layers in hand, build a rolling scorecard, not a one-time calculation. Data observability value compounds as coverage expands and integrations deepen. A single snapshot misses the trajectory entirely.
Track period over period: incidents caught upstream versus downstream, MTTD and MTTR trends, cost-per-incident calculated from the formula, engineering hours reclaimed from reactive work, stakeholder escalations per quarter, and AI pipelines monitored and protected.
Remind leadership of something counterintuitive: the most valuable outcomes your observability platform produces are structurally invisible. The corrupted report that never reached the executive dashboard. The model input that stayed clean. The SLA that was never breached. None of these appear as line items. All of them represent real business value. Your job, quarter over quarter, is to make that absence visible.
Three Pitfalls To Avoid
- Treating ROI as a one-time calculation. Observability value compounds over time. Build a rolling narrative, not a one-off slide.
- Measuring only what the platform reports, not what it prevents. Activity metrics indicate to leadership that the tool is running. They do not tell leadership what would have happened without it. Lead with outcomes.
- Keeping the story inside the data team. Every layer of this framework should connect back to something the business already measures: speed, risk, revenue, or competitive position.
The ROI Is The Silence, Made Visible.
The AI model shipped on time because the training data was clean. The executive dashboard that drove a market decision because the analyst trusted the numbers. The engineering sprint that actually shipped because nobody got pulled into a pipeline fire.
The best data observability platforms do not just prevent problems. They create the conditions for faster decisions, more reliable AI, and a higher-trust data culture to build on each other over time.
Build the framework. Tell the story every quarter. Make sure leadership can see what the silence is worth.
See How Qualdo™ Approaches Data Observability ROI
Qualdo™ combines ML-powered anomaly detection, governed remediation, and AI pipeline monitoring in a single platform, purpose-built for data teams that need to prove outcomes, not just report activity.