
A recommendation model is an algorithm designed to identify and suggest relevant items to users based on a combination of factors. This often includes demography, popularity, and user history. Such a model predicts the most likely items which are of most likely interest to the user. The model will first capture the user’s past behavior and base new recommendations on what we know about the user. However, when a new user appears, we will not have any historical data. In that case, popular items are recommended to them.
The recommendation system deals with huge volumes of data. It will first filter out the most important information based on data from the user and other data containing user interactions, interests, and preferences. The system then tries to determine the relationship between the user and the item and computes the best items for recommendation. There are two major methods to build a recommendation model:
- Collaborative filtering methods: This method works solely based on past interactions between users and items. This method will try to find the taste of similar users from their interactions and generate new recommendations.
- Content-based methods: This method seeks to first create a ‘profile’ for users and items based on the interactions that have happened along with other users – and item-specific features. Then, the model recommends items by drawing from similarities between the profile user and items data.
Can the performance of the recommendation models vary over time?
Yes, it can. The success of every recommendation model is measured based on user satisfaction. The recommended items should be relevant to the user’s interests and preferences. There are a few challenges like the dynamic nature of user behavior, insufficient history data, and so on with the recommendation models, which impact their outcome and affect the performance.
A recommendation system plays a major role in improving business performance for e-commerce, social networks, and other user-centric websites. Here are just some of the benefits:
- Drive traffic
- Deliver relevant content
- Engage users
- Convert inactive shoppers to active customers
- Increase item orders and profits
- Assist the business in making more-informed decisions, e.g., on campaigns or the structure of a product page
Without such a system, a business will face a huge impact on their business revenue and future growth. This forces companies to closely monitor the recommendation model for performance degradation or any other failure that can interrupt the purpose of its service.
Today, most companies are actively trying to solve the following key challenges that are impacting model performance:
- Suppose a new item or user gets added to the system. In that case, the system will not have sufficient clarity on when to recommend new items or what items to recommend to the new user until enough information is gathered.
- If the user has a very low correlation with other users.
- If one profile is suddenly shared by two (or more) users, the system fails to provide personalization suggestions.
- If a user suddenly changes their behavior, where trends, preferences, and interests deviate drastically.
Key parameters of recommendation model monitoring
When evaluating key parameters, the first step is to define various metrics. We want to be clear of what we are trying to measure. There are several predefined metrics that we can make use of here and customize based on your business needs. The following picture shows some of these metrics that can help choose the right set of metrics for our use cases. We will review all these metrics in detail.
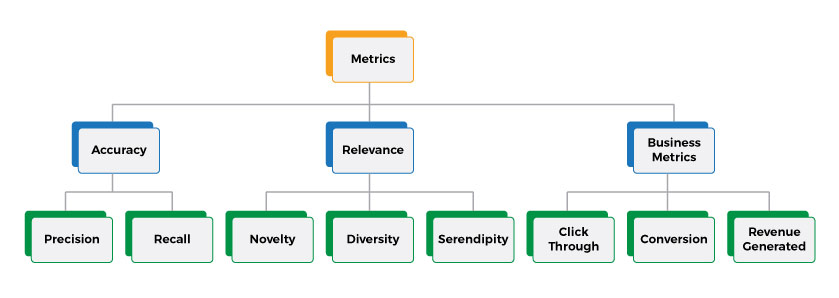
Accuracy metrics
Accuracy metrics focus on how well a given algorithm performs. Given a bunch of recommendations delivered to the user, based on the user’s action on top of them, we can measure these simple metrics.
Typically, precision and recall are the metrics used for measuring the accuracy. They both are very simple to compute and measure given the data.
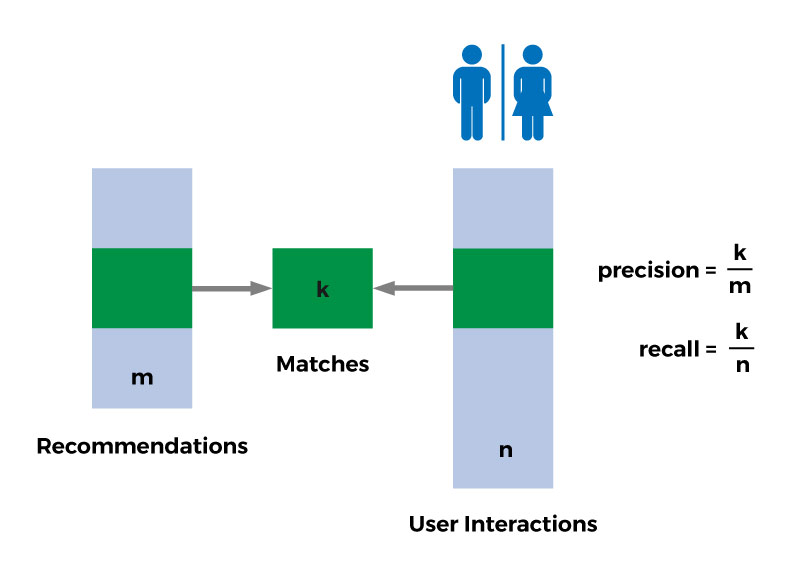
However, it is easy to confuse these two terms. The picture above shows the clear distinction between these two:
- Precision tries to measure given a bunch of recommendations what proportion of them is indeed taken up by the user. That is, when you send out 5 recommendations to the user and the user clicks and views 3 of them and ignores the rest then the precision would be 0.6 (i.e., 3/6).
- Recall tries to measure, out of all the items the user has interacted with (e.g., viewed, liked) how many of them are discovered by the algorithm. For example, if the user has viewed 10 items out of which 5 also present in the list of recommended items, then the value of recall would be 0.5 (i.e., 5/10).
Relevance metrics
Relevance or user satisfaction metrics try to measure some of the aspects around user satisfaction based on the recommendations delivered.
For example, if we focus on only the accuracy metrics, we will probably end up delivering the same recommendations over and over again. This could result in unsatisfied users when they keep seeing the same items in their recommendations. Over time, the users will lose trust in this kind of system and stop looking at their recommended items. That’s why it is so important for us to focus on some of the metrics listed in this section along with the accuracy metrics. These are the metrics that we will review here:
- Novelty: A system’s ability to generate new recommendations over time.
- Diversity: A system’s ability to create a diverse set of recommendations.
- Serendipity: A system’s ability to output unexpected recommendations that add an element of surprise for the users.
There are ways to mathematically represent these metrics, just like the accuracy metrics.
As an example, let’s look at how we can compute diversity: When a bunch of items are recommended, we can measure how diverse the whole bunch of items is by using the following three-step process:
- Computing the pairwise similarity of all item in the batch,
- Computing the sum of all similarity scores,
- The higher a score is, the more diverse the set of items are.
Business metrics
When you want to measure data and identify system-wide trends, business metrics allow you to do exactly that by defining and computing critical insights.
- Click-through rates: when a recommendation is delivered to the user it measures the proportion of them being clicked or viewed by the user.
- Conversion rates: This is a measure on top of click-through on how many users clicking or viewing the recommendations go on to make a purchase or perform a transaction.
- Revenue: When we talk about a campaign, this metric measures how much revenue is generated by the campaign. We should be able to correlate the transactions with the items recommended to be able to measure this.
The set of metrics we have discussed here is no way exhaustive. There are a lot more metrics we can make use of and define custom metrics on top of some of these standard metrics as well.
The Qualdo advantage
Most of the metrics we have discussed here can be computed by collecting data based on a combination of:
- Requests and responses exchanged through recommendation APIs, and
- Users interactions and transactions.
Qualdo empowers you to easily monitor, record, and compute all of these data points. In addition to that, you can apply generated data to measure multiple other metrics.
Some of these data points can be measured in batch mode, simply by iterating over the data points. Like the accuracy metrics precision and recall which can be computed once we have the entire data set on what items are recommended to the users and what they have liked or purchased.
Some additional metrics, like novelty, diversity, and click-through rates, need to be computed for every single request-response exchange separately. Because Qualdo sits right at the model monitoring layer, all of these can be computed automatically using original enterprise data.
To know more about Qualdo, sign-up here for a free trial.