Data Observability
The Data Observability Shift Gartner Saw Coming and What to Do About It

Team Qualdo
10 Apr 2026
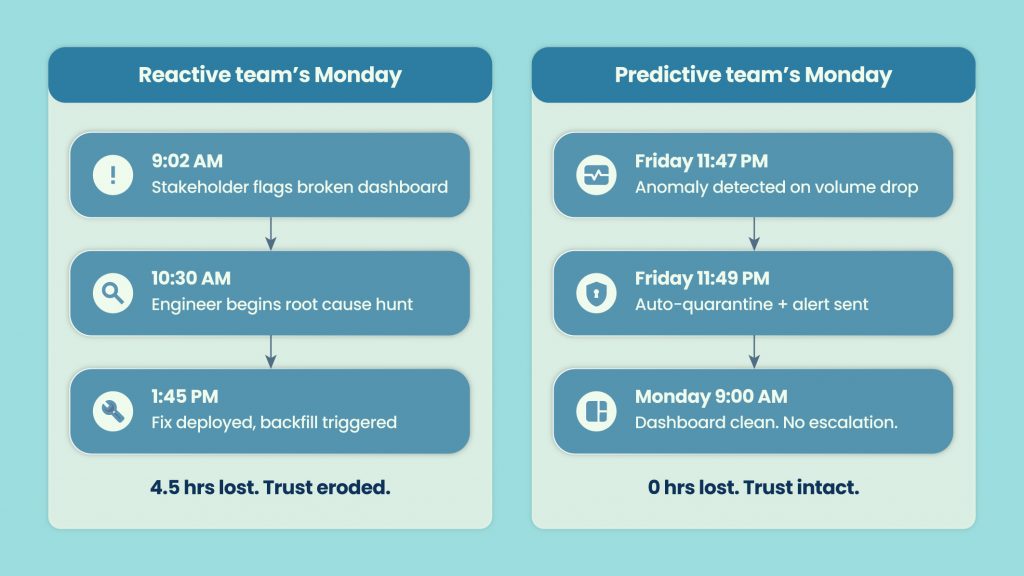
Picture a Monday morning. A stakeholder pings your data team: “The numbers in the board deck look wrong.” That report ran on Friday. The pipeline broke on Wednesday night. Two and a half days of bad data, and nobody on the data team knew.
Sound familiar? That is what reactive monitoring costs you – not just engineering hours, but trust. And that trust takes much longer to rebuild than it does to fix the pipeline.
Research consistently puts data downtime cost in the range of $5,000 to $10,000 per hour for mid-to-large enterprises, once you account for engineering time, stakeholder escalation, and business decisions made on bad numbers. That is not a data quality problem. That is a business reliability problem.
The reactive trap works like this: pipelines break, stakeholders notice, engineers scramble. The cycle repeats. Teams get better at triaging fast, but nobody is stopping the fire before it starts.
That is the shift happening right now. The best data teams are not getting faster at fixing problems. They are catching fewer problems because they moved from alert-and-fix to predict-and-prevent. Gartner’s 2026 Market Guide for Data Observability tools confirms this is no longer an emerging idea – it is a category reaching maturity, and buyer expectations have moved with it.
What the Market Is Telling You
What is data observability? Data observability is the ability to understand the health, state, and behavior of data across your pipelines – in real time, and with enough context to act on it. It goes beyond rule-based checks to monitor freshness, volume, schema, distribution, and lineage continuously, surfacing anomalies before they reach downstream consumers.
Why does it matter more in 2026? Because AI is now in the decision loop. When a model makes a pricing recommendation, a credit decision, or a demand forecast, the quality of that output depends entirely on the quality of the data it consumed. Bad data going into an AI system does not produce an error. It produces a confident wrong answer. That is a different category of risk.
Gartner’s 2026 Market Guide for Data Observability tools signals that this category has crossed the chasm. CDOs and Heads of Data, not just data engineering leads, are now the buyers. Observability spend is showing up in data strategy budgets, not just tool budgets. And the evaluation criteria have shifted from “how many alerts does it fire” to “how much downtime does it prevent.”
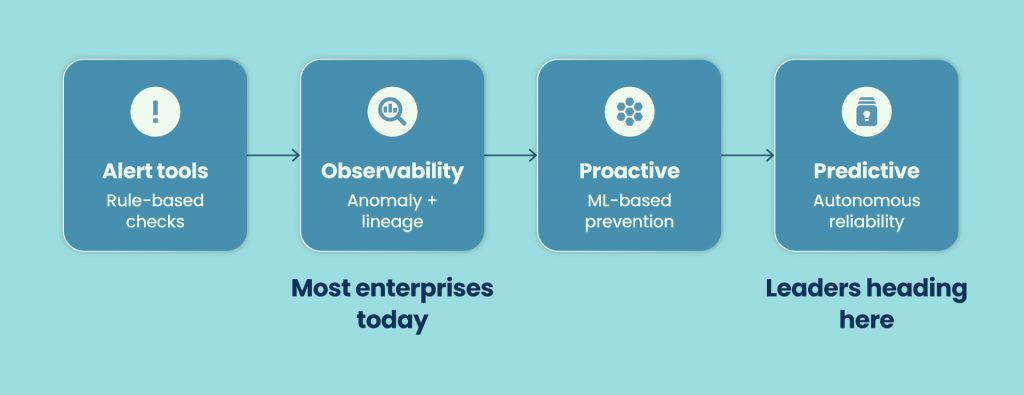
The market is moving from basic monitoring toward what Gartner describes as a maturity curve: from reactive alerting, through anomaly detection, toward predictive and eventually autonomous reliability. Most enterprises today sit somewhere in the middle of that curve. The leaders are pushing toward the right end.
The 5 Pillars of Predictive Data Observability
Good observability is not one thing. It is five things, each covering a different failure mode. Here is what reactive vs. predictive looks like across each:
Freshness – Is data arriving when it should? Reactive: engineer notices a table hasn’t updated and starts digging. Predictive: system flags freshness degradation before the SLA window closes.
Volume – Drops and spikes that compound downstream. Reactive: stakeholder notices row count looks off in a report. Predictive: ML-based thresholds catch a 30% volume drop at ingestion, before it propagates.
Schema – Upstream changes that silently break downstream consumers. Reactive: a dashboard errors out because a column was renamed. Predictive: schema contract violation caught at the source, change blocked or flagged before promotion.
Distribution – Field-level statistics behave differently than normal. Reactive: model performance degrades, root cause traced back to a distribution shift weeks later. Predictive: ML-based anomaly detection catches distribution drift on key features before retraining.
Lineage – Mapping impact across tables, models, and BI layers. Reactive: the engineer manually traces which reports and models touch an affected table. Predictive: lineage graph auto-surfaces impact scope within seconds of an incident.
Where Does Your Team Actually Stand?
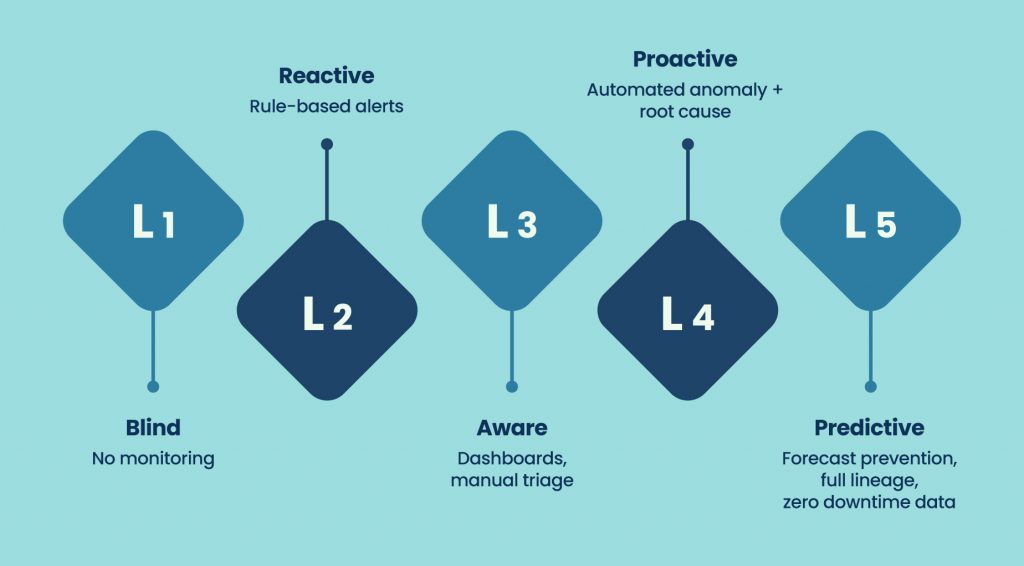
Most data teams think they are more mature than they are. Here is an honest maturity model to check:
Level 1 – Blind: No active monitoring. Issues are discovered by end users or stakeholders. Your data team is in permanent firefighting mode without knowing it.
Quick check: Do you find out about broken pipelines from Slack pings outside your team?
Level 2 – Reactive: Rule-based alerts fire after something breaks. Engineers respond. The incident is fixed. The same incident may return.
Quick check: Are most of your alerts triggered post-failure rather than pre-failure?
Level 3 – Aware: You have dashboards, SLA tracking, and some manual triage process. You know where things tend to break. Response is still human-driven.
Quick check: Does fixing an incident still require a human to manually identify the root cause every time?
Level 4 – Proactive: Automated anomaly detection with root cause signals surfaced. Engineers respond faster because the system did the first layer of triage for them.
Quick check: Does your observability tool tell you why something broke, not just that it broke?
Level 5 – Predictive: Forecast-based prevention. Lineage fully mapped. High-confidence incidents auto-remediated within policy. Data downtime is the exception, not the background noise.
Quick check: Are there incident categories your system now handles without engineer involvement?
How Teams Are Actually Making This Shift
Three scenarios from teams that have moved from reactive to predictive. Names are anonymized but the situations are real.
Scenario A – The CDO who cut MTTD from 6 hours to 19 minutes A financial services data team was averaging six hours between a pipeline failure and detection. The issues were always caught by a business analyst or a stakeholder, not by the data team. After implementing ML-based anomaly detection with automated lineage mapping, that detection window dropped to under 20 minutes. The change was not a process change. It was catching the signal before humans had to.
Scenario B – Schema drift caught before a model retraining run A retail analytics team had a recurring problem: schema changes from upstream source systems were only caught after a model retraining job failed. The fix required rolling back the training run, patching the feature engineering code, and re-queuing. After adding schema contract validation at the pipeline entry point, the team caught three drift events in the first month — before any retraining job consumed the bad data.
Scenario C – Feature store failure traced in under two minutes An AI engineering lead at a SaaS company was troubleshooting a degraded recommendation model. Without lineage tooling, tracing which upstream feature tables were affected took half a day. With automated lineage, the same root cause hunt took 90 seconds. The difference was not engineering skill. It was having the graph already built.
FAQ: How do you move from reactive to proactive data observability?
- Audit your current detection sources – are issues surfaced by tools or by people?
- Implement baseline monitoring on freshness, volume, and schema across critical pipelines.
- Add ML-based anomaly detection on high-value datasets to catch distribution and statistical drift.
- Map lineage for your most critical tables so impact can be scoped automatically.
- Define data SLAs and build alerting around them, not just around failures.
10 Questions to Ask Before You Buy an Observability Tool
Use this as your evaluation checklist – each question maps to a real capability gap, not a vendor feature.
- How fast does it detect anomalies after data arrives? (Detection speed matters more than alert count.)
- Does it surface root cause signals, or just flag that something is wrong?
- How deep is lineage coverage? Does it map across warehouses, models, and BI layers?
- What is the alerting noise ratio? High false-positive rates destroy team trust in the tool.
- Does it monitor AI-critical datasets and ML pipeline inputs separately?
- Can it integrate with your existing orchestration layer without a rip-and-replace?
- Does it support data contracts and schema enforcement, or only post-hoc detection?
- What remediation capabilities exist – recommendations only, or governed automation?
- How are approvals, RBAC, and audit trails handled for automated actions?
- What are the MTTR benchmarks for current customers?
Table stakes vs. differentiators: Table stakes in 2026: freshness monitoring, volume anomaly detection, basic lineage, schema alerts. Differentiators: ML-based distribution monitoring, contract enforcement, governed auto-remediation, cross-stack lineage, AI pipeline observability.
FAQ – What Senior Data Leaders Are Asking
Q: What is the difference between data monitoring and data observability? Data monitoring checks specific rules you define – think assertions and threshold alerts. Data observability goes further: it learns what normal looks like for your data and flags deviations automatically, with lineage context showing what is affected downstream. Monitoring tells you a rule failed. Observability tells you your data is behaving unusually – even if no rule covers it.
Q: Is data observability only for large enterprises? No. The tooling has matured enough that mid-market teams with 5-10 data engineers get meaningful value. The starting point does not have to be full-stack, even basic freshness and volume monitoring on critical pipelines moves a team from blind to reactive, which is a real improvement.
Q: How does predictive observability use machine learning? ML models learn the statistical baselines for your data – typical row counts, value distributions, arrival windows, null rates – and flag deviations that fall outside normal ranges. This is useful because it catches failures that no human would have thought to write a rule for, including gradual drift that would not trigger a hard threshold.
Q: What does the Gartner Market Guide for Data Observability mean for buyers? It signals category maturity. When Gartner covers a tool category in a Market Guide, it means buyers have enough options that evaluation criteria matter. For data teams, it means the conversation with leadership about observability investment now has analyst backing – and it means vendors in this space are being held to a consistent set of capability expectations. Qualdo’s inclusion in the 2026 guide reflects that.
Q: How long does it take to implement data observability? Basic monitoring on critical pipelines — freshness, volume, schema – can be live in days to two weeks. Lineage mapping and ML-based anomaly detection on a production stack typically takes four to eight weeks to get meaningful coverage. Full governance layers and contract enforcement are a longer journey, usually two to three quarters, depending on stack complexity.
The Cost of Waiting One More Quarter
Every AI decision your business makes this quarter runs on data. And the quality of that data is either something you know about, or something you are hoping about.
The teams that have already moved to predictive observability are not spending less time on data quality. They are spending that time differently – on improving pipelines, not fixing them. On building new data products, not triaging old ones. On trusting their data enough to let AI systems act on it.
Predictive data monitoring is not a future state. It is a competitive choice that some teams are already making.
See how Qualdo™ approaches predictive observability – from ML-powered anomaly detection and automated lineage to governed remediation and AI pipeline monitoring.
Explore Qualdo™ or read about our Gartner recognition to understand what independent analyst coverage of this space actually means for your evaluation.