Machine Learning, ML Monitoring
Reliable Production ML Pipelines: Best Practices and Monitoring Tools

Team Qualdo
18 Jul 2025
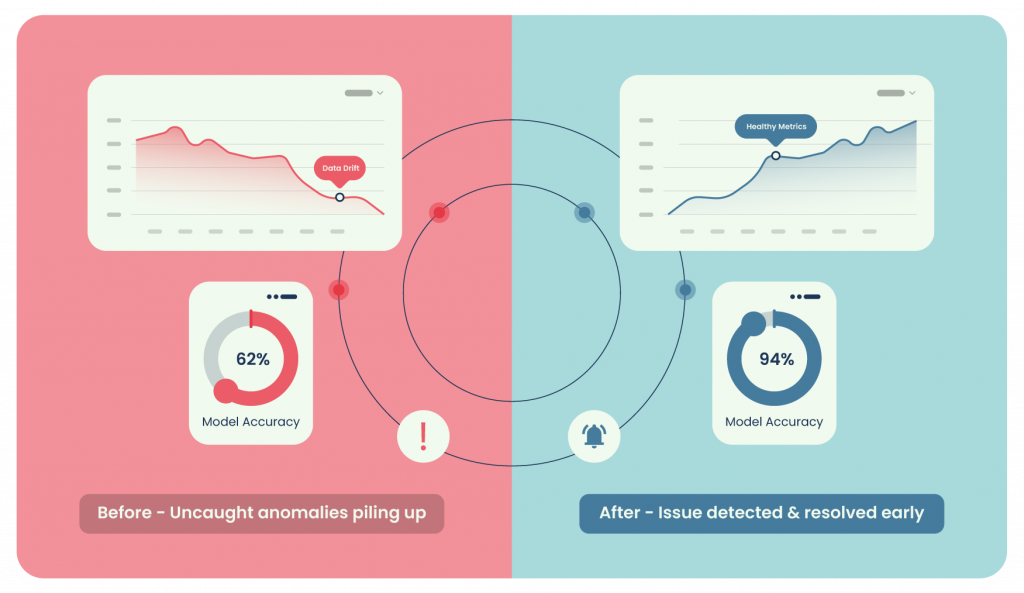
Machine-learning solutions are effective only when they consistently perform in the real world with Reliable Production ML Pipelines. Yet, many teams discover, sometimes too late, that a model that aced validation can falter once it starts handling live data. Real-world failures, such as unexpected churn, revenue drops, or poor user experiences, often trace back to unseen model issues. Latency spikes, data drift, silent accuracy drops, and broken feature pipelines can all quietly erode business value.
Crucially, ML in production is not just about achieving high offline accuracy. It’s about maintaining stable and reliable performance under changing, complex real-world conditions.
In the world of Large Language Models & Small Language Models, there is still relevance for the specific-focused ML models in the deep learning space.
This article lays out practical steps and the right monitoring mindset to build an observable and reliable ML pipeline. In this context, observability refers to transforming hidden failure modes and performance degradations into clear, actionable signals that teams can address promptly.
You will learn how to surface issues early, keep models performant, and respond before users or dashboards feel the pain.
Key takeaway: Data Observability turns silent risks into signals, enabling your team to fix problems long before they hit revenue or user trust.
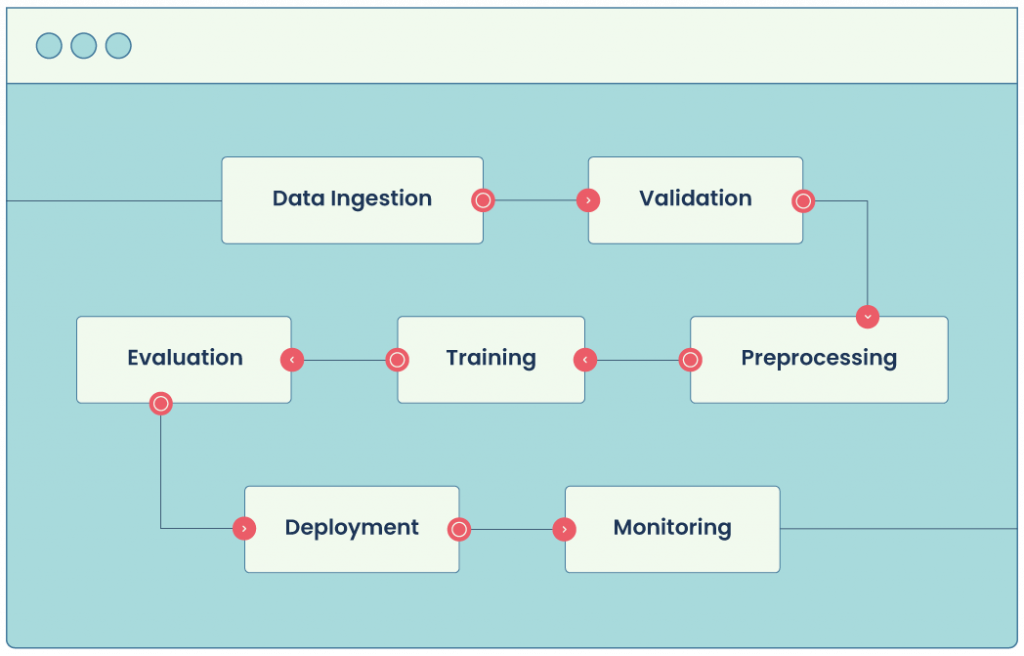
1. Modern ML Pipeline Architecture
Today’s production pipelines rarely sit in a single notebook. They span orchestrators such as Kubeflow or Apache Airflow, utilize containerized training jobs, and deploy via dedicated serving layers. Each stage must emit rich telemetry, metrics, logs, and traces, so that engineers can recreate any prediction path in seconds.
- Orchestration & traceability: Tag every pipeline run and artifact (data, model, config) so you can roll back or compare versions.
- Native integrations: Tools like Kubeflow Pipelines provide built‑in lineage tracking; pair this with TensorFlow’s metadata store to tie model versions to the exact code and data that produced them.
2. Data Ingestion: Quality from the Start
Garbage in, garbage out (GIGO) still rules. Create dedicated ingestion jobs that:
- Standardize formats (e.g., write to TFRecord or Parquet) so that downstream steps never have to guess at schemas.
- Log row counts, missing‑value ratios, and distribution sketches on arrival.
- Quarantine corrupt batches automatically rather than passing them downstream.
Early visibility here prevents mystery ML Model failures four steps down the line.
3. Data Validation: Catch Issues Early
Adopt an always‑on validation gate, powered by TensorFlow Data Validation (TFDV) or a similar library. TFDV:
- Profiles every feature, highlighting type mismatches, schema drifts, and outliers.
- Enforces expectations (min/max, domain lists, business rules) as code, blocking rogue data before training starts.
Automated alerts on validation failures keep the pipeline honest day after day.
4. Data Preprocessing: Align for Learning
Preprocessing is the process by which raw data is transformed into model-ready features. TensorFlow Transform (TFT) lets you:
- Compute scaling, encoding, and bucketing once and apply them identically in training and serving.
- Version each transformation graph so you can trace performance changes back to feature logic, not just weights.
Well‑crafted feature engineering, coupled with traceable transforms, reduces future debugging time dramatically.
5. Model Training & Tuning: Monitor Progress
During training, visibility matters as much as GPUs. Instrument your TensorFlow Trainer (or custom training loop) to emit:
- Loss and metric curves by step/epoch.
- Learning‑rate schedules and gradient norms to flag optimisation pathologies.
- Hyperparameter search results with full metadata, enabling quick rollback to a previous, better‑performing configuration.
Stream these metrics to a central dashboard so teams catch divergence early and avoid wasted compute cycles.
6. Model Evaluation: Continuous Performance Monitoring
Passing offline tests is just the beginning. Tensor Flow Model Analysis (TFMA) lets you evaluate models on live traffic or delayed batches, slicing by customer segment, geography, or device:
- Track accuracy, precision, recall, AUC, and custom business KPIs over time.
- Detect concept drift by comparing incoming feature distributions against training baselines.
- Surface fairness issues by analysing metrics across sensitive slices.
Continuous evaluation allows you to retire or retrain models before customers experience the impact.
7. Deployment & Serving: Seamless Integration
Production reliability hinges on disciplined serving practices:
- TensorFlow Serving (or similar) can load, A/B‑test, and roll back model versions with zero downtime.
- Canary releases expose a small traffic slice to new models, letting you validate latency and accuracy in real conditions.
- Health‑check endpoints and real‑time latency metrics turn “it works on my laptop” into “it still works under load.”
8. Continuous ML Pipeline Monitoring
Even a flawless launch can degrade without continuous oversight. This is where tools like Qualdo-MQX, a dedicated data reliability and observability tool, play a critical role. By combining data-quality checks, model metric tracking, and pipeline lineage into a single console, Qualdo:
- Surfaces schema drifts the moment an upstream source changes.
- Correlates prediction errors with data anomalies, helping teams identify and address root causes more effectively.
- Provides proactive alerts before dashboards turn red, supporting better SLA adherence.
While alternatives focus primarily on model metrics and performance monitoring, Qualdo extends this by integrating data-quality context. This allows teams not only to see that a metric changed but to understand why it changed, whether due to upstream data shifts, feature issues, or model drift, enabling faster and more targeted remediation.
9. Mobile & IoT Monitoring with TensorFlow Lite
Edge deployments introduce constraints (such as battery and connectivity) that can mask silent failures. Best practice:
- Embed lightweight telemetry in your TensorFlow Lite models to capture input summaries, inference latency, and confidence drops.
- Batch-upload these signals when the device is online and feed them to the same monitoring layer that oversees cloud models.
This unified view keeps on‑device models aligned with their server‑side counterparts.
Conclusion
A disciplined, observable ML pipeline is the difference between a one-off success and a sustainable, trusted product. By validating data early, tracking training signals, evaluating in real time, and adding continuous monitoring from ingestion to mobile inference, teams can deliver high-performing models consistently.
To make this concrete, consider these next steps:
- Audit your current pipeline maturity. Identify gaps in data validation, monitoring coverage, and model performance tracking.
- Establish early data quality checks. Prevent issues before they cascade downstream.
- Implement continuous evaluation. Move beyond offline tests to real-time monitoring on live segments.
- Add robust alerting and root-cause analysis. Ensure your team can respond before users or business metrics are impacted.
- Integrate observability tools. Bring together data, model, and pipeline signals into a unified view.
Silent failures don’t have to be inevitable. With the right foundation, they become rare, detectable, and fixable before they threaten trust or revenue.
Qualdo supports this journey by providing end-to-end visibility, proactive alerting, and actionable insights across every stage of the ML workflow.