
The objective of this article is to discuss ways in which we can monitor and report drift. As we discussed in the previous article monitoring the drift as it occurs is a crucial step in addressing the same.
We will go through in detail six different ways in which we can monitor the drift.
- Visual analysis on data distribution
- Automated detection through hypothesis testing
- Study of the correlation matrix
- Study of variable importance in the model
- Monitoring through model accuracy metrics
- Dissecting the monitoring of accuracy metrics
1. Visual analysis of data distribution
As we discussed in part of the earlier article on the model drift, change in data distribution is a very common type of drift that can occur in any environment.
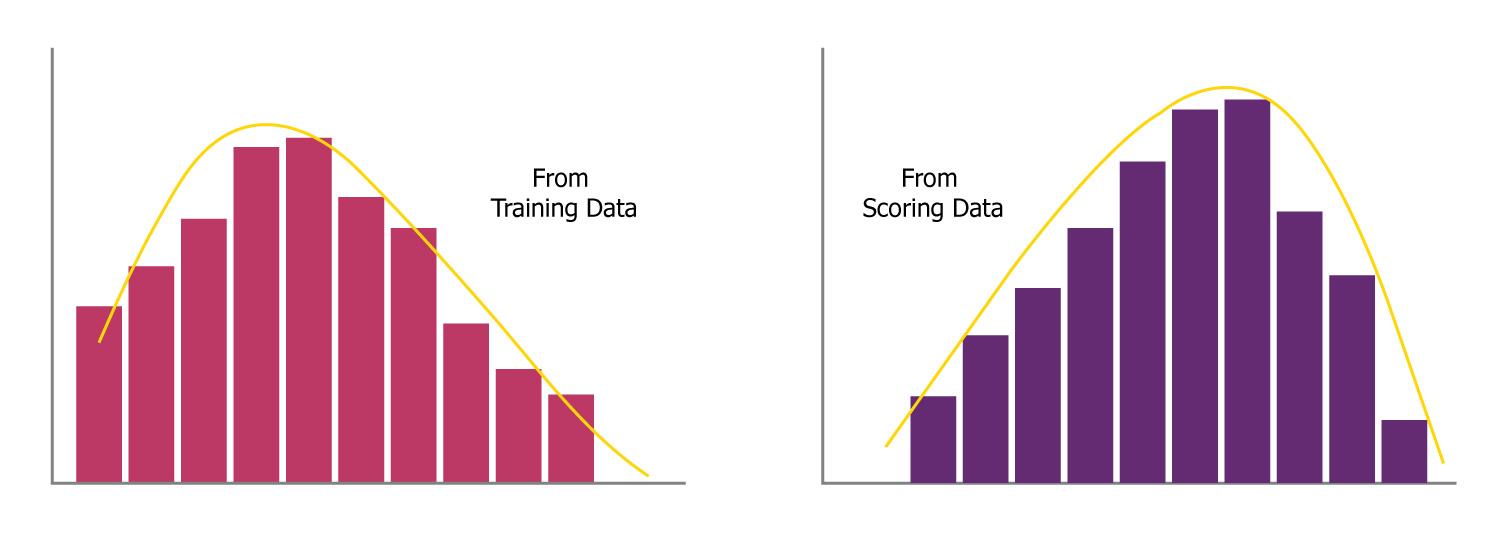
As can be seen in the picture above, comparing the distribution of data across training and scoring datasets is a straightforward way of spotting and monitoring data drift. This is a common functionality provided by many tools to compare and understand the drift.
Following are some of the pros of this approach,
- Very intuitive and easy to interpret
- Easy to understand and convey to the rest of the team
Following would be some of the limitations of this approach,
- When changes are hard to spot and track visually we will tend to miss recognizing the presence of drift
- It requires someone to manually keep a watch on these charts and keep monitoring the same
- Especially when we deal with a lot of features, it will become really cumbersome to rely on this approach
2. Automated detection through Hypothesis testing
As we discussed above one of the problems with the visual analysis method is the requirement for someone to keep a watch on it manually. One of the remedies for this problem would be to make use of Hypothesis testing to automatically monitor the occurrences of drift in the data.
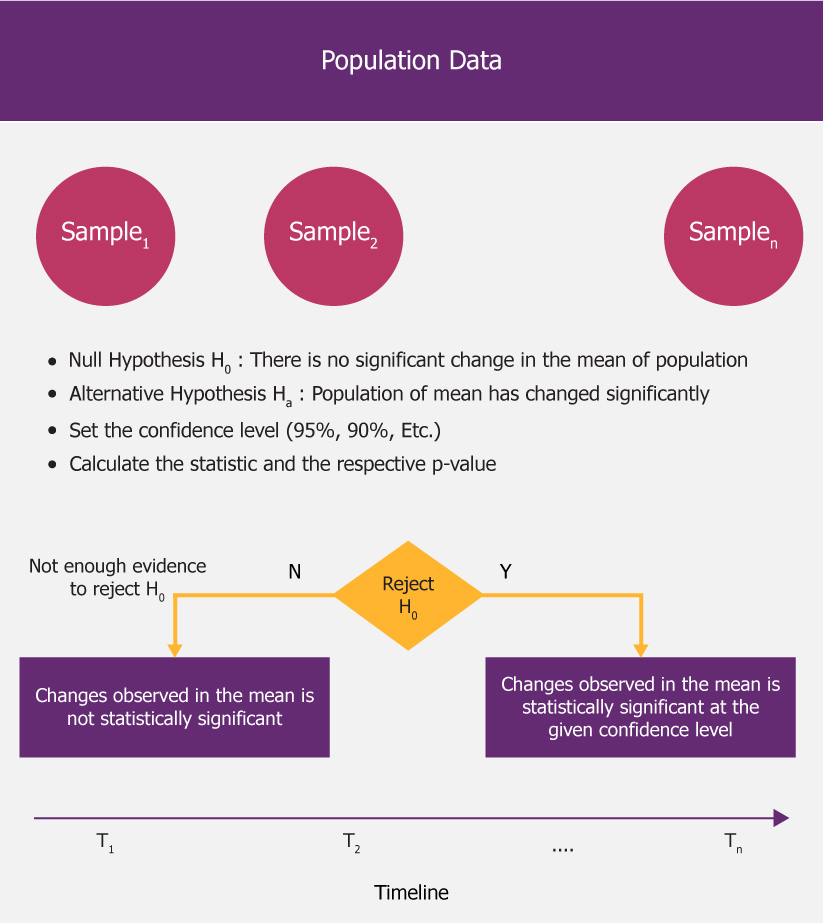
For example, through hypothesis testing, we can monitor the distribution and identify if there is a significant change in the mean. Along with other statistical measures like variance, standard deviation, etc. A significant change in any of these statistical measures means that the data distribution has changed significantly.
The following steps summarize how we perform this.
- As can be seen in the picture here we can set up this simple population vs sample hypothesis testing
- It is very easy to run these statistical tests like p-test, t-test, etc. when we choose two datasets to run on top of
- Which will provide a completely automated way of monitoring the drift in data (i.e. distribution) and report the same
- We can perform similar statistical testing on other statistics like variance and standard deviance as well
Once we provide it as an automated functionality, we can detect and report this automatically across all the features and the target variable. We can define a strategy to retrain the models based on some threshold we can define on the number of features where drift is detected.
Related Read: A Primer On Monitoring Recommendation Models.
3. Study of the correlation matrix
This approach is all about computing and comparing correlation matrices between training and scoring datasets. Any significant changes detected in the correlation values among the features and the target variables can be detected and highlighted through this mechanism.
While the first two approaches focused on the data drift this one focuses more on the concept drift. This could be a side effect of the data drift as well. But we detect the changes through the relationship among the features and the target variable.
Following would be the benefits of using this approach,
- Any significant changes detected here can straightaway help us tune the model
- For example, if there is a feature becoming less correlated with the target variable, we can drop it from the next version of the model trained
- Similarly, we can start introducing new features based on the high correlation detected with the target variable
- We can detect the problem of multicollinearity based on the correlation between features and handle them accordingly as well
- We can also decide to transform some of the features and bring them into the new versions of the models
4. Study of variable importance
This approach would be to study the changes occurring in the variable importance factors. We can use different metrics like p-value, variable importance, Gini-coefficient, etc. based on the type of model we use.
We can detect any significant changes occurring in the variable importance and flag them to drop some of the features from the new versions of the models.
Following would be the benefits of using this approach.
- Any significant changes detected here can help us drop some of the features in the newer versions
- We can also take other actions like transforming a few features, bringing in new features, etc.
- Some of the features that were not used earlier can be substituted for the features that we take out of the model
The difference between this approach and the previous one is that here we are using the metrics capturing variable importance factors from the models. Whereas the study of correlation matrix helps us analyze the data irrespective of the underlying models we use.
5. Monitoring through model accuracy metrics
This is a straightforward approach. We are trying to put continuous monitoring of the model accuracy metrics to detect the decay of the model’s predictive power or performance.
We can monitor a combination of the following metrics for this purpose.
- Mean absolute error (MAE)
- Mean squared error (MSE)
- Root mean squared error (RMSE)
- Precision
- Recall
- F1-score
Depending on the type of problem we are dealing with (i.e. regression or classification) and the model technique used we can choose different metrics to monitor the performance.
We can compare the performance of the model with the training and scoring dataset based on how the numbers look on these datasets.
6. Dissecting model accuracy metrics
This is like an extension of the previous approach. Where we can dissect the accuracy metrics to get a detailed insight of changes in data distribution on the model’s performance.
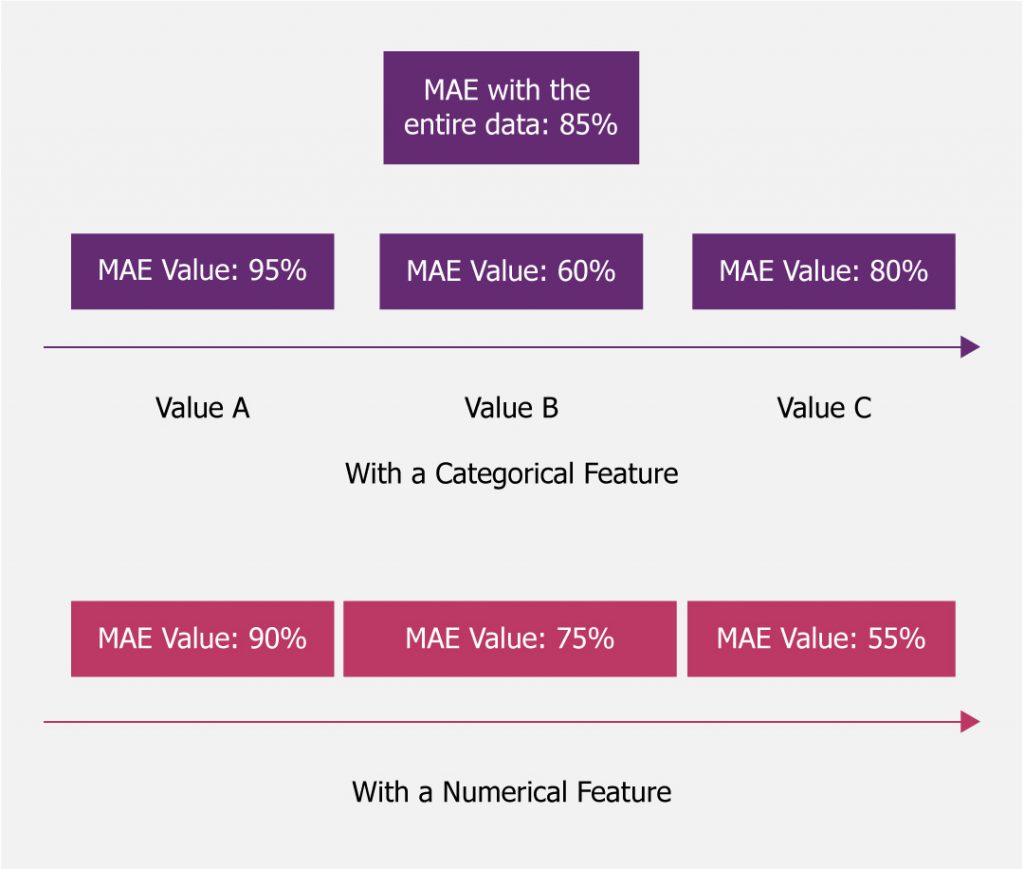
As can be seen in the picture above we can get a much more drilled-down view of how the model performs on different subsets of the data.
- Dissecting as can be seen in the picture here will provide some clues on when the model performs well and when it is not
- Based on this we can try to understand any impact of the changes in data on the model performance
- For example, let’s say,
- With the higher values of the numerical feature where we observe a dip in performance
- When we look at the training data there are hardly any records with values in that range
- Then that clearly explains due to the drift of the feature value the model is losing predictive power here
This will help us with coming out with probably new versions of the models catering to different subsets of the datasets.
Conclusion
We have looked at various approaches to monitor model drift. You can make use of some of these approaches to have effective monitoring of drift in place to ensure the model can be retrained accordingly.
Where monitoring and detecting become the first crucial step. As can be seen with some of the approaches, it also helps us in deciding on how to tune the models while retraining as well.